
In today’s digital construction era, architects, structural and MEP engineers are developing BIM models for different disciplines creating a single federated BIM model.
One of the stepping stones to optimal project completion is dealing with design issues sooner rather than later, saving time, money, and other resources.
Clash detection analysis is not a new concept in the AEC industry and with today`s BIM tools, professionals are able to deal with potential problems on the construction site in the early design stages.
Using BEXEL Manager`s knowledge base with customizable Clash detection and Selection Set templates, it is possible to run hundreds of predefined clash jobs immediately.
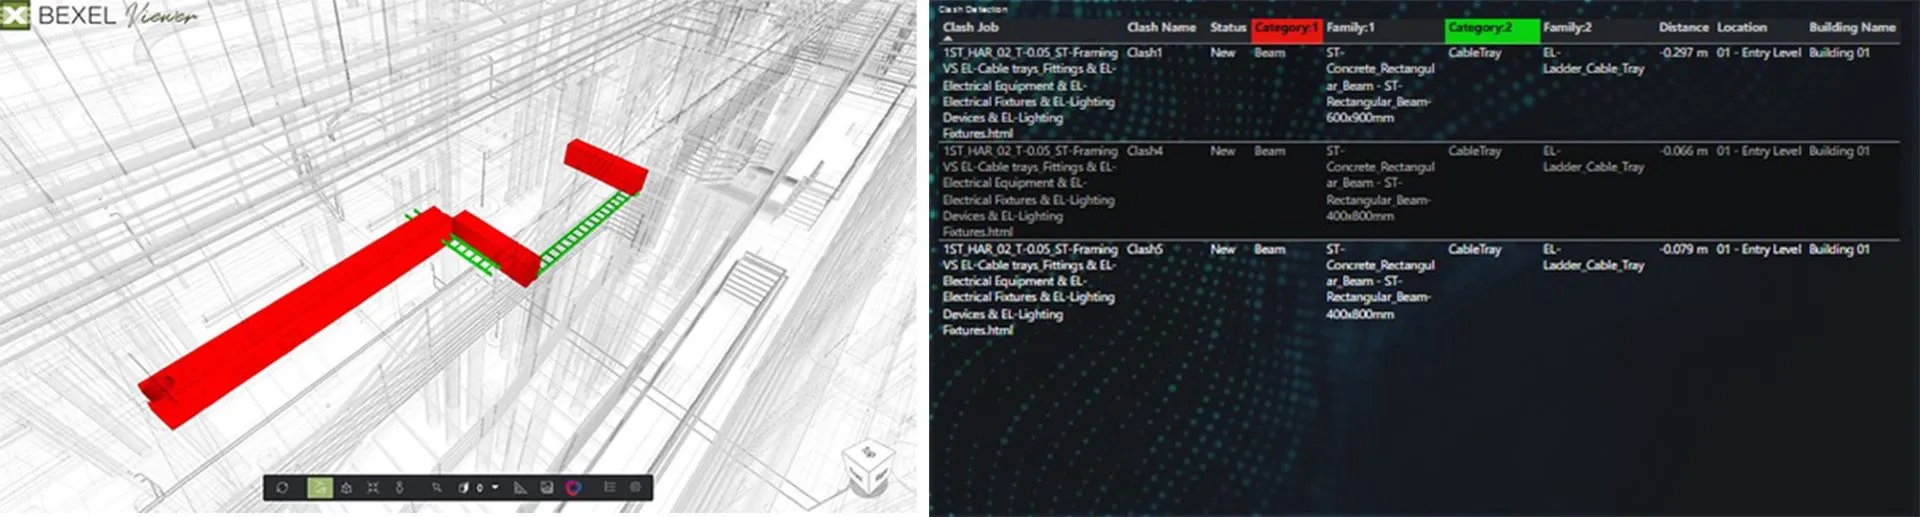
BEXEL Manager`s advanced technology allows integration of cloud-based BEXEL Viewer with Power BI and takes the whole clash detection workflow a step further with visualization and presentation of clashes using its synergy with the Power BI platform, allowing stakeholders to pinpoint them in a web browser environment.
What are the benefits of the clash detection analysis dashboard using BEXEL Manager & Microsoft Power BI integration?
With automatic export from BEXEL Manager and cloud-based BEXEL CDE integration with Microsoft Power BI, complete analysis and results are accessible through a web browser on any computer or mobile device.

Using BCF collaboration integrated with BEXEL CDE, further exchange of clash issues (with information such as status, assigned person, deadline, etc.) is seamless and quick.
The dashboard is fully customizable as well, making it possible to create a tailor-made layout for any specific team`s workflow.
What are the possibilities of BEXEL Manager & Microsoft Power BI dashboards?
BEXEL Manager – Microsoft Power BI dashboard allows stakeholders to explore clash detection analysis using powerful visualization and filtering engines.
In an interactive layout, there are numerous filtering options e.g., by building, categories, families, clash distance, clash jobs, etc. It is possible to pinpoint a particular clash both visually, in a 3D environment, provided by BEXEL CDE, as well as using data such as distance, floor, building, etc.
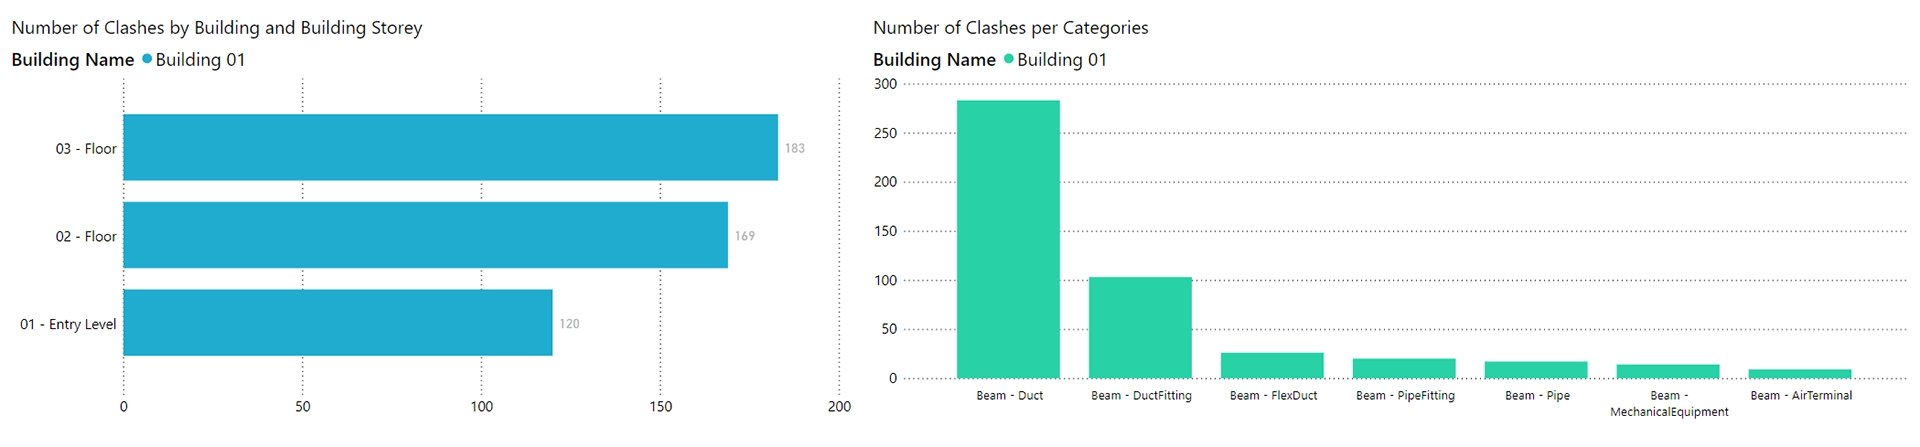
On the statistical side, for each of mentioned filters, stakeholders have insight into both numbers of clashes found in the construction design and their current status.
Complete statistical data is presented in interactive graph forms linked to a cloud-based BEXEL CDE, facilitating real-time visual 3D filtering.
Additionally, in BEXEL CDE, it is possible to take measurements, export screenshots, toggle between different view modes, and preview element properties.
Aside from the Clash detection analysis dashboard, there are different knowledge base templates for the Model explorer, Earned value, 5D estimation, and Resource earned value. Everything is available to explore and live test in the BEXEL Manager Command Center.


